
Local weather intelligence
SEQ Weather Room
Live local conditions, radar, storm guidance, river gauges and warnings across South East Queensland.

Warnings
Your watchlist
Favourite locations
Choose up to five locations for quick access.
System check
Data freshness
Regional scan
SEQ at a glance
Rain tracking
Live weather radar
Choose the native SEQ Weather frame player or Windy's interactive weather radar.
Radar data supplied through the SEQ Weather API. Bureau attribution will appear when a radar is selected.
Interactive weather radar supplied by Windy. Pan or zoom to inspect other areas.
Interactive forecast maps
SEQ Model Explorer
Open over SEQ and the Darling Downs, zoom out across Australia, step through the next five days and switch between Best Match, GFS and ECMWF guidance.
SEQ maps use mapped towns and a regional sample grid. Australia maps use a coarser national sample grid intended for broad synoptic guidance. Pointer values are interpolated guidance, not street-level observations or official warnings.
Modelled ingredients
Storm environment
Hourly instability, moisture and freezing-level guidance with an independent location control.
Vertical atmosphere
Atmospheric profile and hodograph
Pressure-level profiles are model guidance. Hodograph winds are plotted in kilometres per hour; storm motion and boundary orientation are not included.
Regional comparison
Strongest storm signals across the region
The supercell environment category combines modelled CAPE, approximate surface-to-500 hPa wind difference, Lifted Index and inhibition. It describes environmental support only—not the probability of a storm occurring, an official forecast or a warning. Local boundaries, storm motion and convective initiation can change the outcome.
Official observations
Nearby river and creek gauges
Recent automatic gauge readings selected for the town currently shown above.
Automatic river readings may be delayed or incorrect and receive limited quality checking. Always follow official flood warnings and never enter floodwater.
Right now
Conditions across SEQ and surrounding districts
Explore SEQ, the Darling Downs, Southern Downs, Granite Belt, Gympie and surrounding districts.
Bureau observation
Nearest official station
Modelled rainfall
Rainfall outlook
Himawari-9
Satellite imagery
Animate and inspect recent cloud imagery over SEQ, Queensland and Australia without leaving the Weather Room.
Data credits and methodology
Himawari-9 imagery is operated by the Japan Meteorological Agency and hosted for public use by CIRA/RAMMB (Colorado State University, in partnership with NOAA). SEQ Weather assembles the time sequence, region controls and explanatory display. A Bureau composite is used automatically if the primary imagery is delayed.
Satellite imagery shows cloud and surface features, not rainfall at the ground. Primary imagery is Himawari-9 data hosted by CIRA/RAMMB (NOAA/Colorado State University); the automatic fallback composite is supplied by the Bureau of Meteorology. Use radar and official warnings for local severe-weather decisions.
Storm tracking
Live lightning across SEQ
Explore recent community-detected lightning activity without leaving the Weather Room.
Lightning map: Community observations supplied by Blitzortung.org and LightningMaps.org.
This map is not an official warning service and may contain delays or detection gaps. Follow official warnings and move indoors when thunder is heard.
Situation dashboard
Hazards and live data feeds
Official Queensland alerts, QFD incidents, Seqwater infrastructure, Energex and Ergon outages, and statewide air quality brought together without sending you around the internet.
Warning polygons, circles and incident points show the area supplied in each official feed. They are approximate, may be delayed and do not show the exact fire edge, storm path or impact boundary.
Queensland
Emergency Alerts
Loading current alerts…
Storm, flood and cyclone
Severe-weather alerts
Loading current weather alerts…
Statewide feed
Queensland bushfire incidents
Current fire incidents and official warnings supplied by the Queensland Fire Department are included statewide. Public vehicle counts are delayed snapshots and may change as crews respond.
Loading current incidents…
Nearest monitors
Air quality
Loading station readings…
Energex + Ergon
Queensland power outages
Loading current outage data…
Seqwater
Dam levels and releases
Loading dam and release data…
Ensemble guidance
Forecast confidence
ECMWF and GFS ensemble spread shows how tightly the possible forecast outcomes cluster.
Forecast guidance
ECMWF and GFS comparison
Choose any mapped town and compare three major models. Differences are normal and useful for judging forecast confidence.
Warm-season monitoring
Tropical weather and cyclone outlook
Native Australian-region cyclone monitoring using current JTWC systems and significant tropical-weather advisories.
Loading JTWC tropical guidance…
JTWC uses one-minute sustained winds and provides guidance for United States government interests. For Australian warning decisions, Bureau of Meteorology warnings remain authoritative.
Long-range influences
Climate drivers
Track ENSO, the Indian Ocean Dipole, Madden–Julian Oscillation and Southern Annular Mode using official Bureau and NOAA indices.
Pacific Ocean monitoring
Niño regions — weekly SST anomaly
Sea-surface temperature departure from average in the four Pacific monitoring regions, updated weekly. ENSO status is judged on Niño 3.4.
Observation and forecast
MJO phase-space studio
Compare the observed tropical pulse with ensemble guidance for its possible movement during the next fortnight.


Data credits and methodology
Observed and forecast phase-space products are produced by NOAA’s Climate Prediction Center using the Wheeler–Hendon RMM framework. The numerical tracker above uses Bureau RMM data when available.
Ocean monitoring
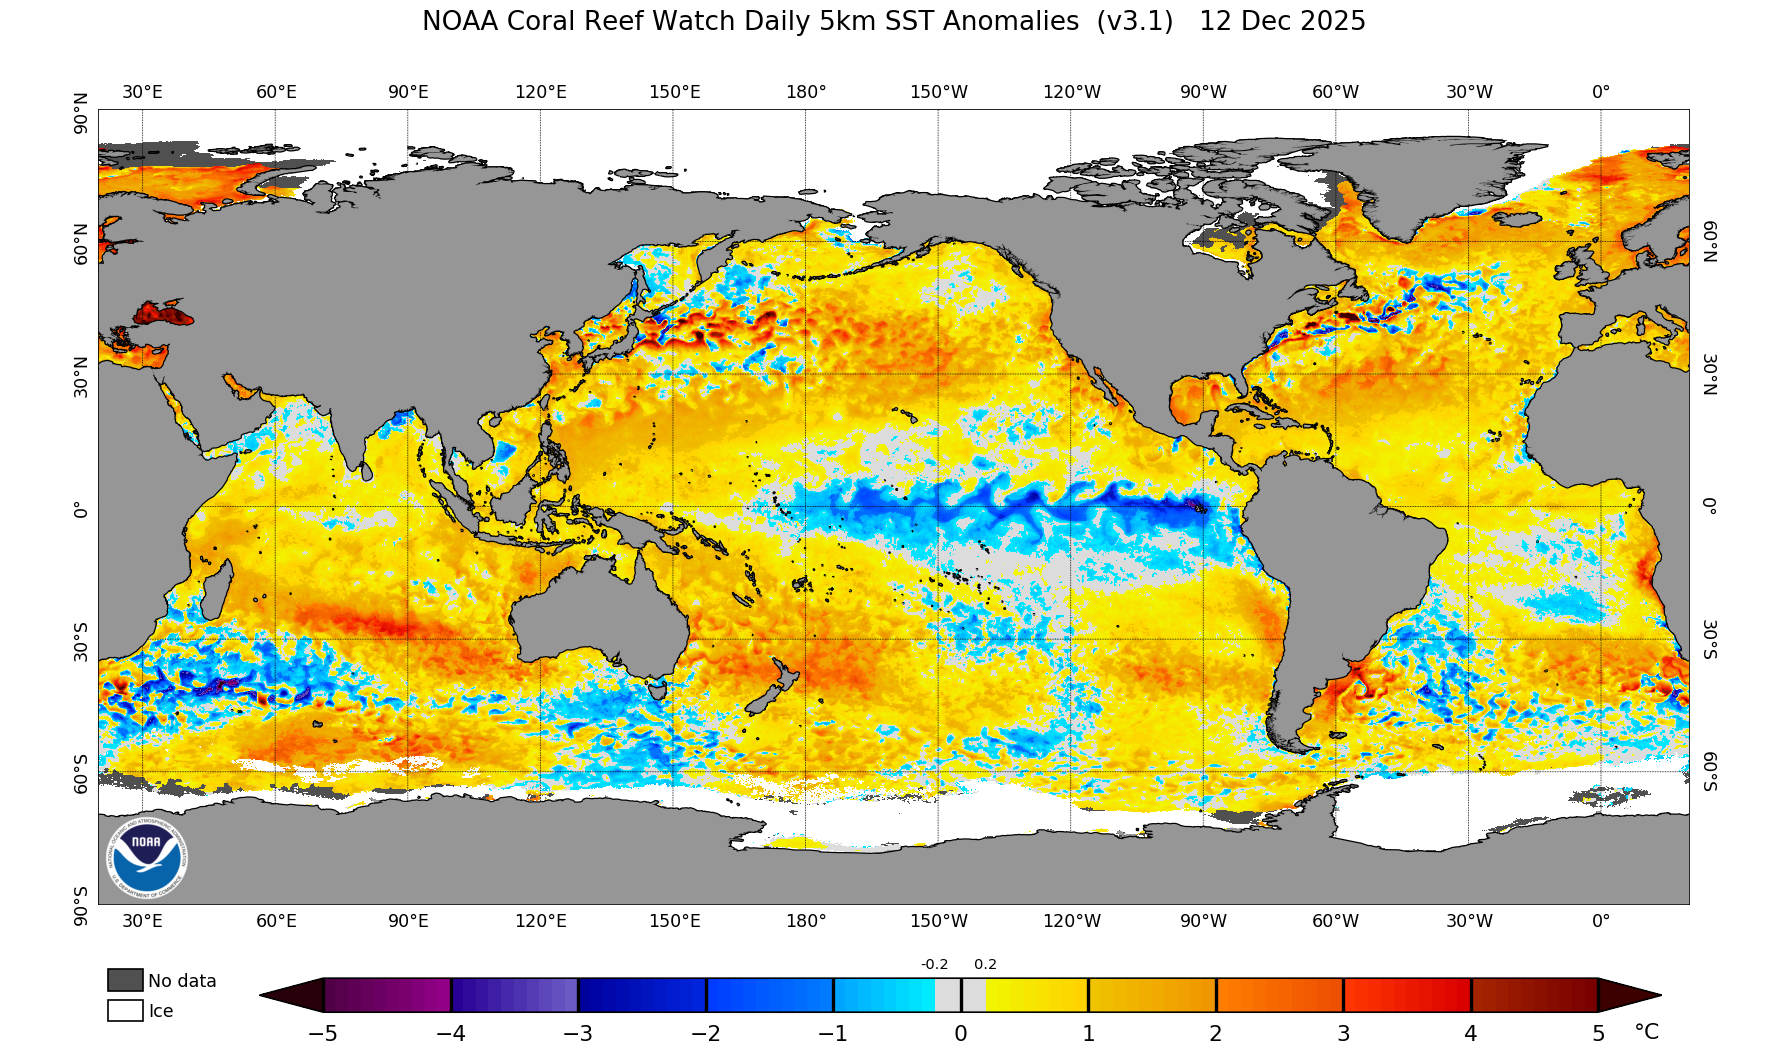
Global sea-surface temperature anomalies
Daily NOAA satellite analysis showing where ocean temperatures are warmer or cooler than the long-term average.
Data credits and methodology
The sea-surface temperature anomaly analysis is produced daily by NOAA/NESDIS OSPO. Product methodology and archive
SST anomalies can influence moisture availability, tropical development and broad climate patterns. They do not determine whether an individual storm or rainfall event will occur.
Climate drivers influence seasonal probabilities, not individual storms or rainfall events. Local forecasts and official warnings remain the primary guidance.
Latest forecast · 16 Sep 2026
SEQ Weather Forecast – 17 SEPTEMBER 2026
Bit of a mixed bag across SEQ tomorrow. Most spots will be partly cloudy, with Toowoomba and Warwick seeing more sun than cloud. Ipswich gets a touch warmer…
Read the full forecast